


Introduction
Facility Management (FM) is no longer just about fixing broken equipment or keeping the lights on. Today, FM plays a strategic role in reducing operational costs, supporting sustainability goals, and creating productive workplaces. But how do you measure success? The answer lies in Key Performance Indicators (KPIs).
According to a 2023 report by IFMA (International Facility Management Association), organizations that track performance metrics in FM reduce operating costs by up to 15% annually. Let’s explore the essential KPIs every FM should monitor.

1. Space Utilization Rate
Office space is one of the most expensive assets for any organization, yet studies by JLL show that 30–40% of workplace space is underutilized daily. With the rise of hybrid and flexible work, it’s more important than ever to measure how effectively space is being used.
Why it matters:
-
Reduces wasted rent and energy costs.
-
Guides space reallocation (e.g., converting underused meeting rooms into collaboration hubs).
-
Supports real estate planning and workplace strategy.
How to measure:
(Occupied space ÷ Total available space) × 100
Example: If your office has 50,000 sq. ft. but only 30,000 sq. ft. is regularly used, your utilization rate is 60%. A rate below 70% often signals wasted resources. Explore link: JLL Report on Workplace Utilization

2. Work Order Completion Rate
Work orders reflect how well the maintenance team responds to needs across the facility. A backlog can lead to downtime, safety risks, and dissatisfied employees.
Why it matters:
-
Ensures reliability of assets and systems.
-
Improves employee trust in FM responsiveness.
-
Reduces long-term repair costs.
How to measure:
(Number of completed work orders ÷ Total work orders) × 100
Example: If 500 work orders are created in a month and 450 are completed, the rate is 90%. A rate consistently below 80% may indicate staffing shortages, poor scheduling, or inefficient processes.
Explore more link:Glorek Work Order Benchmarking

3. Maintenance Cost per Square Foot
Maintenance expenses are a major line item in FM budgets. By tracking costs per square foot, facility managers can compare performance against industry benchmarks and identify inefficiencies.
Industry fact: According to the BOMA Experience Exchange Report, average annual maintenance costs are $2.23 per square foot in the U.S. for office buildings.
Why it matters:
-
Provides a standardized measure across buildings.
-
Highlights cost overruns caused by aging infrastructure or poor preventive maintenance.
-
Supports accurate budgeting and financial planning.
Example: If an office of 100,000 sq. ft. has annual maintenance costs of $250,000, the cost per sq. ft. is $2.50 — higher than the industry average, signaling inefficiency.

4. Energy Consumption & Efficiency
Energy is often the largest controllable operating expense, with the U.S. Department of Energy estimating that commercial buildings waste 30% of the energy they consume.
Why it matters:
-
Reduces utility costs and carbon footprint.
-
Supports compliance with sustainability certifications like LEED and WELL.
-
Identifies areas for retrofits, upgrades, or renewable integration.
How to measure:
Energy use intensity (EUI) = Annual energy consumption (kWh) ÷ Building square footage.
Example: If a 50,000 sq. ft. office consumes 1,500,000 kWh annually, its EUI is 30 kWh/sq. ft. Lower numbers are better.
🔗 Internal link: Sustainable FM Practices

5. Reactive vs. Preventive Maintenance Ratio
A healthy FM program focuses on preventive work to reduce emergencies. Industry best practice is 70–80% preventive vs. 20–30% reactive.
Why it matters:
-
Preventive maintenance extends equipment life and avoids costly breakdowns.
-
Reactive-heavy operations increase downtime, safety risks, and emergency costs.
-
Balance helps allocate resources effectively.
Example: If 300 preventive tasks and 100 reactive tasks are completed monthly, the ratio is 75:25 — an ideal balance. A 50:50 split, however, indicates over-reliance on firefighting.
Internal link: Benefits of Preventive Maintenance
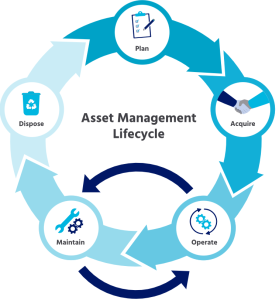
6.Asset Lifecycle Cost & Performance
Every asset — from HVAC units to elevators — has a predictable lifespan. Tracking lifecycle costs helps facility managers decide whether to repair, replace, or upgrade equipment.
Why it matters:
-
Prevents overspending on aging equipment.
-
Optimizes capital planning.
-
Ensures assets deliver expected ROI.
Real fact: ASHRAE data shows replacing HVAC systems at the right lifecycle stage can reduce costs by 15–20%.
Example: If a chiller’s maintenance costs exceed 50% of its replacement value, it may be more economical to replace it.
🔗 Internal link: AI Management in FM
Conclusion
Tracking KPIs is not just a reporting exercise — it’s a strategic necessity. From space utilization and work orders to energy efficiency and occupant satisfaction, these metrics help facility managers:
-
Cut unnecessary costs
-
Improve operational efficiency
-
Enhance employee experience
-
Support sustainability goals
By embedding KPI tracking into daily operations, FM leaders can transform their roles from cost centres into strategic business partners.